The bottom line: MCP servers are infrastructure — treat them like any other production service. Most teams deploy MCP servers with zero visibility into what happens inside them. Based on analysis of over 16,400 MCP implementations and 300+ production servers, 73% of outages originate at the transport/protocol layer, yet it’s the most commonly overlooked in monitoring setups Zeo Blog. MCP Server Observability: Monitoring, Testing & Performa…. This guide walks through the three-layer observability model, OpenTelemetry instrumentation, metric targets, and alerting thresholds that turn MCP server management from reactive firefighting into predictive engineering.
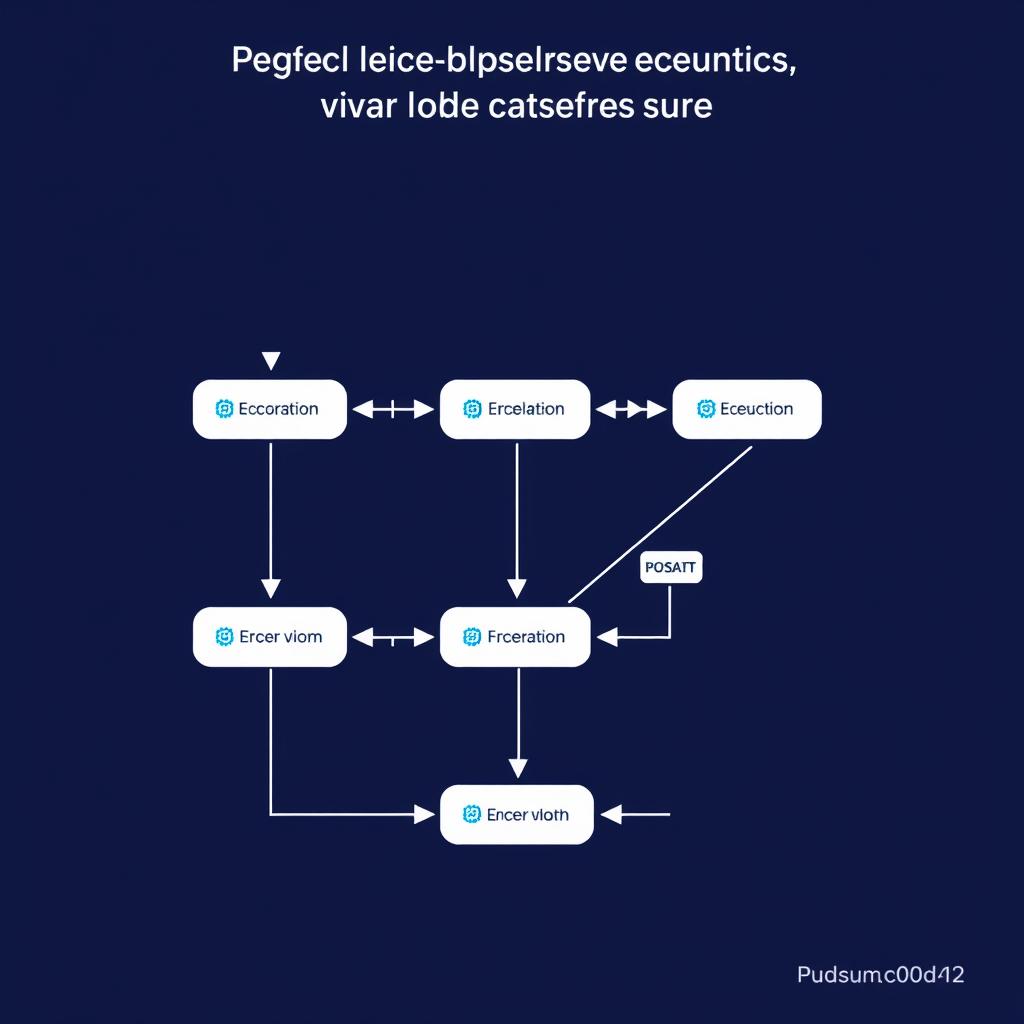
The Three-Layer Observability Model
Failures in MCP servers cascade upward. A transport handshake failure produces a tool execution failure, which produces a failed agent task. You need correlated signals across all three layers to identify root causes Zeo Blog. MCP Server Observability: Monitoring, Testing & Performa….
Layer 1: Transport/Protocol
The transport layer handles connections — STDIO for local, HTTP+SSE or WebSocket for remote. This is where 73% of production outages start Zeo Blog. MCP Server Observability: Monitoring, Testing & Performa….
Key indicators Zeo Blog. MCP Server Observability: Monitoring, Testing & Performa…:
- Handshake success rate — Target >99.9% for STDIO, >99% for HTTP+SSE. A sustained drop precedes outages by 15-30 minutes Zeo Blog. MCP Server Observability: Monitoring, Testing & Performa….
- Handshake duration — <100ms local, <500ms remote. Spikes indicate network congestion or server load Zeo Blog. MCP Server Observability: Monitoring, Testing & Performa….
- Average session duration — Sudden drops suggest memory leaks, client crashes, or network issues Zeo Blog. MCP Server Observability: Monitoring, Testing & Performa….
- JSON-RPC error rates — Overall target <0.1%. Specific error codes tell different stories Zeo Blog. MCP Server Observability: Monitoring, Testing & Performa…:
-32601(method not found) >0.5% → tool hallucination by the agent Zeo Blog. MCP Server Observability: Monitoring, Testing & Performa…-32603(internal error) → immediate alert, server-side bug
- Message serialization latency — <10ms target. High latency here means JSON parsing is a bottleneck Zeo Blog. MCP Server Observability: Monitoring, Testing & Performa….
- Message latency (p90/p99) — p99 >1000ms triggers user churn Zeo Blog. MCP Server Observability: Monitoring, Testing & Performa….
- Capability negotiation failures — 80% occur during client upgrades. Track version mismatches Zeo Blog. MCP Server Observability: Monitoring, Testing & Performa….
Layer 2: Tool Execution
Every tool exposed by an MCP server is a potential single point of failure. Treat each tool as a microservice and apply the SRE Golden Signals Zeo Blog. MCP Server Observability: Monitoring, Testing & Performa…:
Latency: Target p50 <50ms, p95 <200ms, p99 <500ms. A single slow tool degrades overall responsiveness by 3-5x because the agent must wait for completion before continuing its reasoning loop Zeo Blog. MCP Server Observability: Monitoring, Testing & Performa….
Traffic: Track calls-per-tool distribution. The 80/20 rule holds — 20% of tools handle 80% of load. These are your single points of failure Zeo Blog. MCP Server Observability: Monitoring, Testing & Performa….
Errors: Distinguish between 4xx errors (agent misuse, ambiguous tool descriptions) and 5xx errors (actual tool bugs). Differentiating these reduces MTTR by up to 75% Zeo Blog. MCP Server Observability: Monitoring, Testing & Performa….
Saturation: Monitor concurrent execution. Most tools hit saturation between 50-100 concurrent executions Zeo Blog. MCP Server Observability: Monitoring, Testing & Performa….
Token usage per tool call — This reveals cost optimization opportunities. Teams have reported finding 10-100x cost differences between tools, going from $15,000/month to $500/month after re-engineering expensive tool calls Zeo Blog. MCP Server Observability: Monitoring, Testing & Performa….
Layer 3: Agentic Performance
This layer measures what end users actually care about — does the agent accomplish its goal? The key metrics here are:
Task Success Rate (TSR): Target 85-95%. Measured via explicit user feedback, final state verification, or LLM-as-a-judge evaluation Zeo Blog. MCP Server Observability: Monitoring, Testing & Performa….
Turns-to-Completion (TTC): Optimal range is 2-5 turns. When TTC exceeds 7 turns, abandonment rates increase by 60% Zeo Blog. MCP Server Observability: Monitoring, Testing & Performa….
Tool Hallucination Rate: Expect 2-8% in production. Correlates with JSON-RPC -32601 errors at Layer 1 Zeo Blog. MCP Server Observability: Monitoring, Testing & Performa….
Self-Correction Rate: Target 70-80% with proper error feedback (error → reflect → correct → success). Without structured error messages, this drops to 30-40% Zeo Blog. MCP Server Observability: Monitoring, Testing & Performa….
OpenTelemetry Span Architecture
MCP server instrumentation follows a hierarchical trace structure that maps directly to the agent execution model OneUptime. How to Instrument MCP Servers with OpenTelemetry for Pr…:
| Span | Parent | Key Attributes |
|---|---|---|
session |
(root) | mcp.session.id, agent.id (anonymized) |
task |
session | mcp.task.description, mcp.task.success, mcp.task.turns |
turn |
task | mcp.turn.number, mcp.turn.tool_count |
tool.call |
turn | mcp.tool.name, mcp.tool.parameters, mcp.tool.duration_ms, mcp.tool.hallucination |
tool.retry |
tool.call | mcp.retry.attempt, mcp.retry.reason |
This hierarchy lets you ask questions like “which tools are involved in failed sessions?” and “what’s the median duration of tool calls before a hallucination?” without correlating separate log files OneUptime. How to Instrument MCP Servers with OpenTelemetry for Pr….
Python Instrumentation Implementation
Install the OpenTelemetry packages:
pip install opentelemetry-sdk opentelemetry-api \
  opentelemetry-exporter-otlp-proto-http \
  opentelemetry-instrumentation
Create an instrumentation wrapper that intercepts MCP tool calls:
from opentelemetry import trace, metrics
from opentelemetry.sdk.resources import Resource
from opentelemetry.sdk.trace import TracerProvider
from opentelemetry.sdk.trace.export import BatchSpanProcessor
from opentelemetry.exporter.otlp.proto.http.trace_exporter import OTLPSpanExporter
from opentelemetry.sdk.metrics import MeterProvider
from opentelemetry.sdk.metrics.export import PeriodicExportingMetricReader
from opentelemetry.exporter.otlp.proto.http.metric_exporter import OTLPMetricExporter
import time
import json

# Initialize OpenTelemetry SDK
resource = Resource.create({
    "service.name": "mcp-server",
    "service.version": "1.0.0",
    "mcp.server.name": "production-tools",
})

trace_provider = TracerProvider(resource=resource)
trace_provider.add_span_processor(
    BatchSpanProcessor(OTLPSpanExporter(
        endpoint=f"{os.environ['OTEL_EXPORTER_OTLP_ENDPOINT']}/v1/traces"
    ))
)
trace.set_tracer_provider(trace_provider)

metric_exporter = OTLPMetricExporter(
    endpoint=f"{os.environ['OTEL_EXPORTER_OTLP_ENDPOINT']}/v1/metrics"
)
meter_provider = MeterProvider(
    resource=resource,
    metric_readers=[PeriodicExportingMetricReader(metric_exporter, export_interval_ms=15000)]
)
metrics.set_meter_provider(meter_provider)

tracer = trace.get_tracer("mcp-server")
meter = metrics.get_meter("mcp-server")

# Define instruments
tool_call_counter = meter.create_counter(
    "mcp.tool.calls",
    description="Number of MCP tool invocations"
)
tool_duration_histogram = meter.create_histogram(
    "mcp.tool.duration",
    description="Duration of tool calls in ms",
    unit="ms"
)
tool_error_counter = meter.create_counter(
    "mcp.tool.errors",
    description="Number of tool errors"
)

async def instrumented_tool_call(tool_name: str, params: dict, handler):
    """Wrap an MCP tool handler with OpenTelemetry instrumentation."""
    attributes = {"mcp.tool.name": tool_name, "mcp.server.name": "production-tools"}
    start_time = time.monotonic()

    with tracer.start_as_current_span(f"mcp.tool/{tool_name}", attributes=attributes) as span:
        try:
            tool_call_counter.add(1, attributes)
            result = await handler(params)

            # Check for error content in response
            if result.get("is_error") or any(
                c.get("type") == "text" and str(c.get("text", "")).startswith("Error:")
                for c in result.get("content", [])
            ):
                span.set_status(trace.Status(trace.StatusCode.ERROR, "Tool returned error"))
                tool_error_counter.add(1, attributes)
            else:
                span.set_status(trace.Status(trace.StatusCode.OK))

            return result

        except Exception as e:
            span.set_status(trace.Status(trace.StatusCode.ERROR, str(e)))
            span.record_exception(e)
            tool_error_counter.add(1, attributes)
            raise

        finally:
            duration_ms = (time.monotonic() - start_time) * 1000
            tool_duration_histogram.record(duration_ms, attributes)
Node.js/TypeScript Instrumentation
For Node.js-based MCP servers (common with the FastMCP library), use the OpenTelemetry JS SDK OneUptime. How to Instrument MCP Servers with OpenTelemetry for Pr…:
import { NodeSDK } from "@opentelemetry/sdk-node";
import { OTLPTraceExporter } from "@opentelemetry/exporter-trace-otlp-http";
import { OTLPMetricExporter } from "@opentelemetry/exporter-metrics-otlp-http";
import { PeriodicExportingMetricReader } from "@opentelemetry/sdk-metrics";
import { resourceFromAttributes } from "@opentelemetry/resources";
import { trace, metrics, SpanStatusCode } from "@opentelemetry/api";

const sdk = new NodeSDK({
  resource: resourceFromAttributes({
    "service.name": "mcp-server",
    "mcp.server.name": "production-tools",
  }),
  traceExporter: new OTLPTraceExporter({
    url: process.env.OTEL_EXPORTER_OTLP_ENDPOINT + "/v1/traces",
  }),
  metricReader: new PeriodicExportingMetricReader({
    exporter: new OTLPMetricExporter({
      url: process.env.OTEL_EXPORTER_OTLP_ENDPOINT + "/v1/metrics",
    }),
    exportIntervalMillis: 15000,
  }),
});

sdk.start();
Critical Alert Thresholds
Not all metrics need alerts. These are the thresholds that indicate real production problems Zeo Blog. MCP Server Observability: Monitoring, Testing & Performa…:
| Signal | Metric | Threshold | Severity |
|---|---|---|---|
| Transport health | Handshake success rate | below 99% over 5 min | Critical |
| Protocol errors | JSON-RPC -32603 |
Any occurrence | Critical |
| Tool reliability | Error rate per tool | above 5% over 10 min | High |
| Latency degradation | p95 tool execution | above 500ms over 15 min | High |
| Agent health | Task Success Rate | below 80% over 30 min | High |
| Tool hallucination | -32601 rate |
above 1% over 15 min | Medium |
| Cost anomaly | Token usage per tool | over 3x baseline | Medium |
| Saturation | Concurrent executions | over 80% of limit | Medium |
The 5-minute window for transport health is not arbitrary — handshake drops reliably precede full outages by 15-30 minutes, giving you time to investigate before users notice Zeo Blog. MCP Server Observability: Monitoring, Testing & Performa….
OpenTelemetry Collector Configuration
For production deployments, route MCP telemetry through an OpenTelemetry Collector for batching, filtering, and routing to multiple backends OneUptime. How to Instrument MCP Servers with OpenTelemetry for Pr…:
receivers:
  otlp:
    protocols:
      http:
        endpoint: 0.0.0.0:4318
      grpc:
        endpoint: 0.0.0.0:4317

processors:
  batch:
    timeout: 5s
    send_batch_size: 1024
  attributes:
    actions:
      - key: environment
        value: production
        action: upsert
  filter:
    error_mode: ignore
    metrics:
      metric:
        - 'mcp.tool.duration.bucket'  # Drop raw histogram buckets
        - 'mcp.tool.duration.count'   # Keep only summary

exporters:
  otlphttp:
    endpoint: https://your-observability-backend.example.com
  prometheus:
    endpoint: 0.0.0.0:8888
    resource_to_telemetry_conversion:
      enabled: true

connectors:
  spanmetrics:
    histogram:
      explicit:
        buckets: [5ms, 10ms, 25ms, 50ms, 100ms, 250ms, 500ms, 1s, 5s]
    dimensions:
      - name: mcp.tool.name
      - name: mcp.server.name

service:
  pipelines:
    traces:
      receivers: [otlp]
      processors: [batch, attributes]
      exporters: [otlphttp, spanmetrics]
    metrics:
      receivers: [otlp, spanmetrics]
      processors: [batch]
      exporters: [otlphttp, prometheus]
This collector configuration does three things beyond simple forwarding:
- Batches data to reduce egress costs.
- Generates span metrics — automatically produces RED metrics (Rate, Errors, Duration) from trace data, giving you per-tool call rates and error counts without manual instrumentation.
- Exposes Prometheus endpoints for local debugging even when the remote backend is unreachable OneUptime. How to Instrument MCP Servers with OpenTelemetry for Pr….
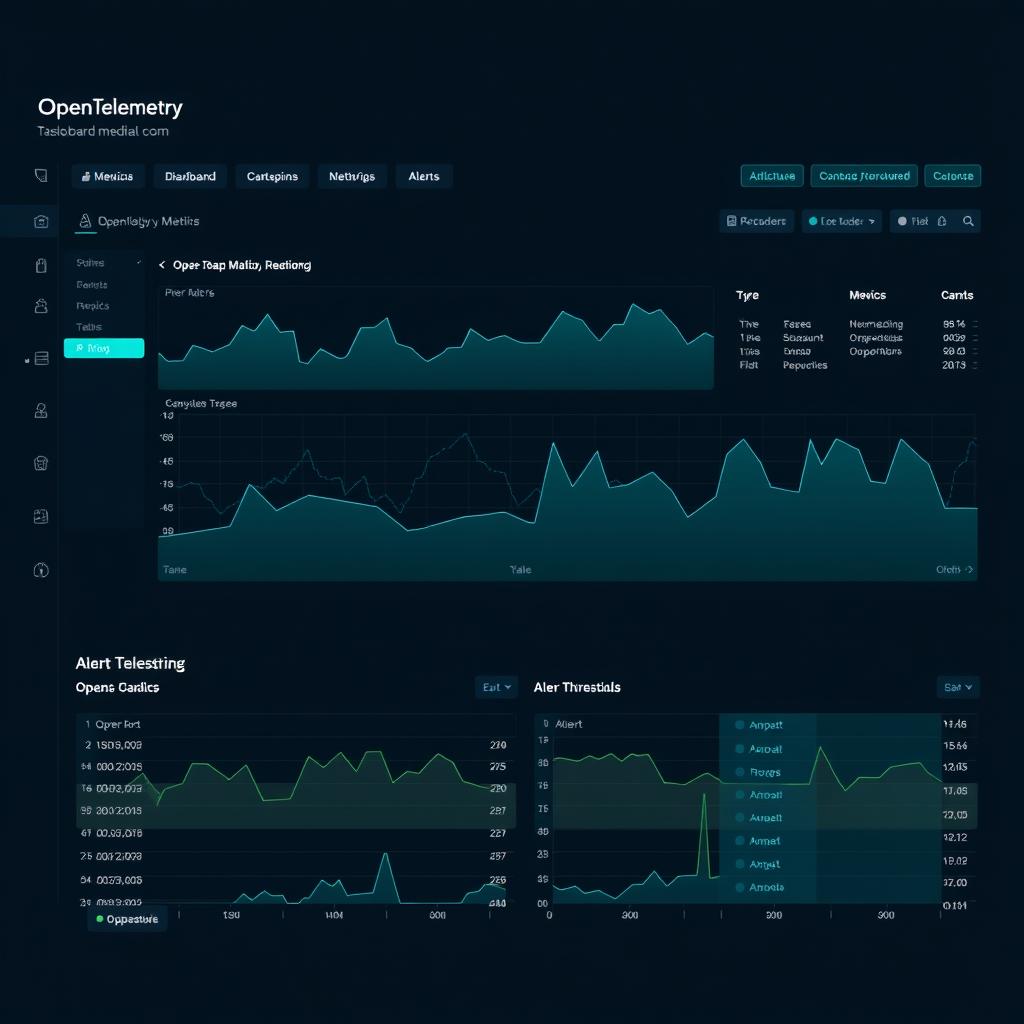
Dashboards: What to Display
A production MCP observability dashboard should answer these questions at a glance:
Top Row — Service Health
- Handshake success rate (last 1h, sparkline)
- Active sessions
- Total tool calls/min
- Overall TSR
Middle Row — Tool Performance
- Top 5 tools by latency (p95, sorted desc)
- Top 5 tools by error rate
- Tool call volume heatmap (tool × time)
Bottom Row — Agent Behavior
- Turns-to-completion distribution
- Tool hallucination rate over time
- Self-correction rate over time
The dashboard shouldn’t be the place you discover problems — alerts should tell you. The dashboard is for pattern analysis after the alert fires Zeo Blog. MCP Server Observability: Monitoring, Testing & Performa….
Decision Matrix
| Setup | Observability Investment | Minimum Signals |
|---|---|---|
| 1-5 MCP servers, internal | Minimal | Handshake rate, tool latency, error count |
| 5-50 servers, customer-facing | Standard | Full OTel spans + metrics, PagerDuty alerts, TSR tracking |
| 50+ servers, multi-region | Heavy | eBPF kernel monitoring, anomaly detection, predictive alerting |
The range from minimal to heavy is about a 10x difference in setup cost. For teams starting out, instrumenting just handshake rate and tool error counts covers the 73% of outages that start at the transport layer Zeo Blog. MCP Server Observability: Monitoring, Testing & Performa….
Key Takeaways
- MCP servers need three-layer observability: transport/protocol, tool execution, and agentic performance. Failures cascade upward — you need correlated signals across all three.
- 73% of production outages start at the transport layer. Monitor handshake success rate and JSON-RPC error codes before anything else Zeo Blog. MCP Server Observability: Monitoring, Testing & Performa….
- Use OpenTelemetry’s hierarchical span structure (session→task→turn→tool.call) to trace agent behavior end-to-end without correlating separate log files OneUptime. How to Instrument MCP Servers with OpenTelemetry for Pr….
- Differentiate between 4xx errors (agent misuse, fixable with better tool descriptions) and 5xx errors (real bugs) — this cuts MTTR by up to 75% Zeo Blog. MCP Server Observability: Monitoring, Testing & Performa….
- Route through an OpenTelemetry Collector for batching, span-to-metric generation, and multi-backend export.
- Set alerts on transport health (below 99% handshake rate = critical), tool error rate (above 5% = high), and TSR (below 80% = high) Zeo Blog. MCP Server Observability: Monitoring, Testing & Performa…. Use 5-minute windows to catch incipient outages before users notice.
Zeo Blog. MCP Server Observability: Monitoring, Testing & Performa… Zeo Blog. “MCP Server Observability: Monitoring, Testing & Performance Metrics.” September 2025. Based on analysis of 16,400+ MCP implementations and 300+ production MCP servers. Zeo Blog
OneUptime. How to Instrument MCP Servers with OpenTelemetry for Pr… OneUptime. “How to Instrument MCP Servers with OpenTelemetry for Production Observability.” March 2026. OneUptime
Related Reads
- MCP Server Production Deployment Patterns — Deployment architecture, auth, and scaling strategies for MCP servers
- Building MCP Tool Gateway with FastMCP — Production MCP server patterns for tool access layer
- AI Agent Observability Guide 2026 — Full observability stack for AI agents with tracing, metrics, and production monitoring
Cross-links automatically generated from NiteAgent.
← Back to all posts