The bottom line: Two competing semantic conventions exist for encoding AI agent behavior into OpenTelemetry traces — the OTEL-community GenAI semantic conventions and the open-source OpenInference standard. The choice matters because switching conventions later means re-instrumenting every span. Arthur AI’s engineering team chose OpenInference for its richer LLM metadata, first-class RAG support, and explicit span types — a decision that mirrors what most production agent teams face in 2026 Arthur AI, 2026. This post gives you a head-to-head comparison and copy-paste setup code for three major frameworks.
Why the Semantic Convention Choice Matters
OpenTelemetry gives you vendor-neutral instrumentation — you emit traces once and choose any compatible backend without re-instrumenting your code. For AI agents that span services, APIs, databases, and other agents, that portability is critical.
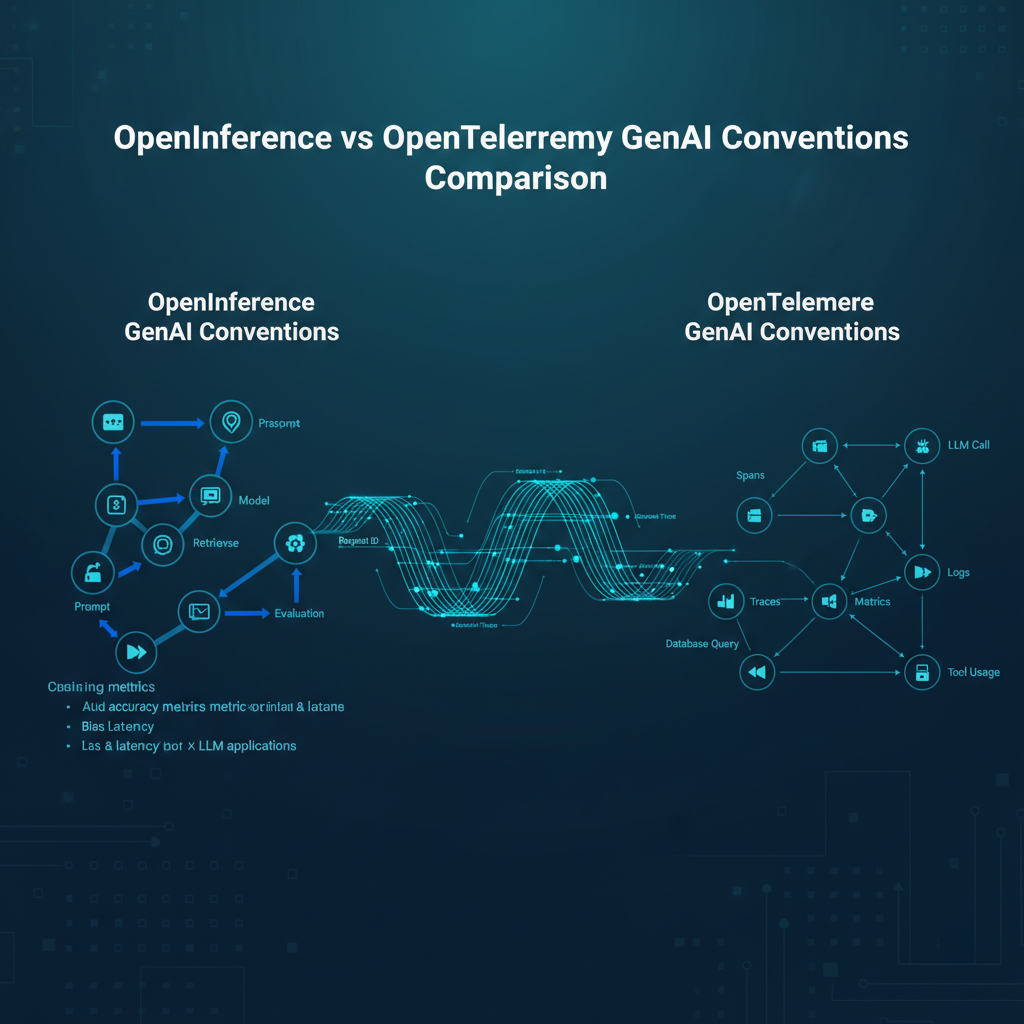
But OpenTelemetry only defines the transport. The semantic conventions determine what data lives inside your spans. And for AI agents, two competing conventions have emerged:
| Aspect | OpenInference | OTEL GenAI Conventions |
|---|---|---|
| LLM metadata | Full prompt/completion, token counts, cost, model params | Basic model name + token counts |
| Span types | 6 types: LLM, TOOL, AGENT, CHAIN, RETRIEVER, RERANKER | 3 types: LLM, Chat, Embedding |
| RAG support | Explicit retrieval and re-ranking spans | Generic span attributes |
| Message types | system, user, assistant, tool, document | system, user, assistant |
| Tool representation | Full tool definitions + call parameters | Tool call ID + name |
| Auto-instrumentation | LangChain, LlamaIndex, OpenAI, Google ADK, CrewAI, Haystack | Limited ecosystem support |
| Community | Arize AI + open-source contributors | OpenTelemetry community SIG |
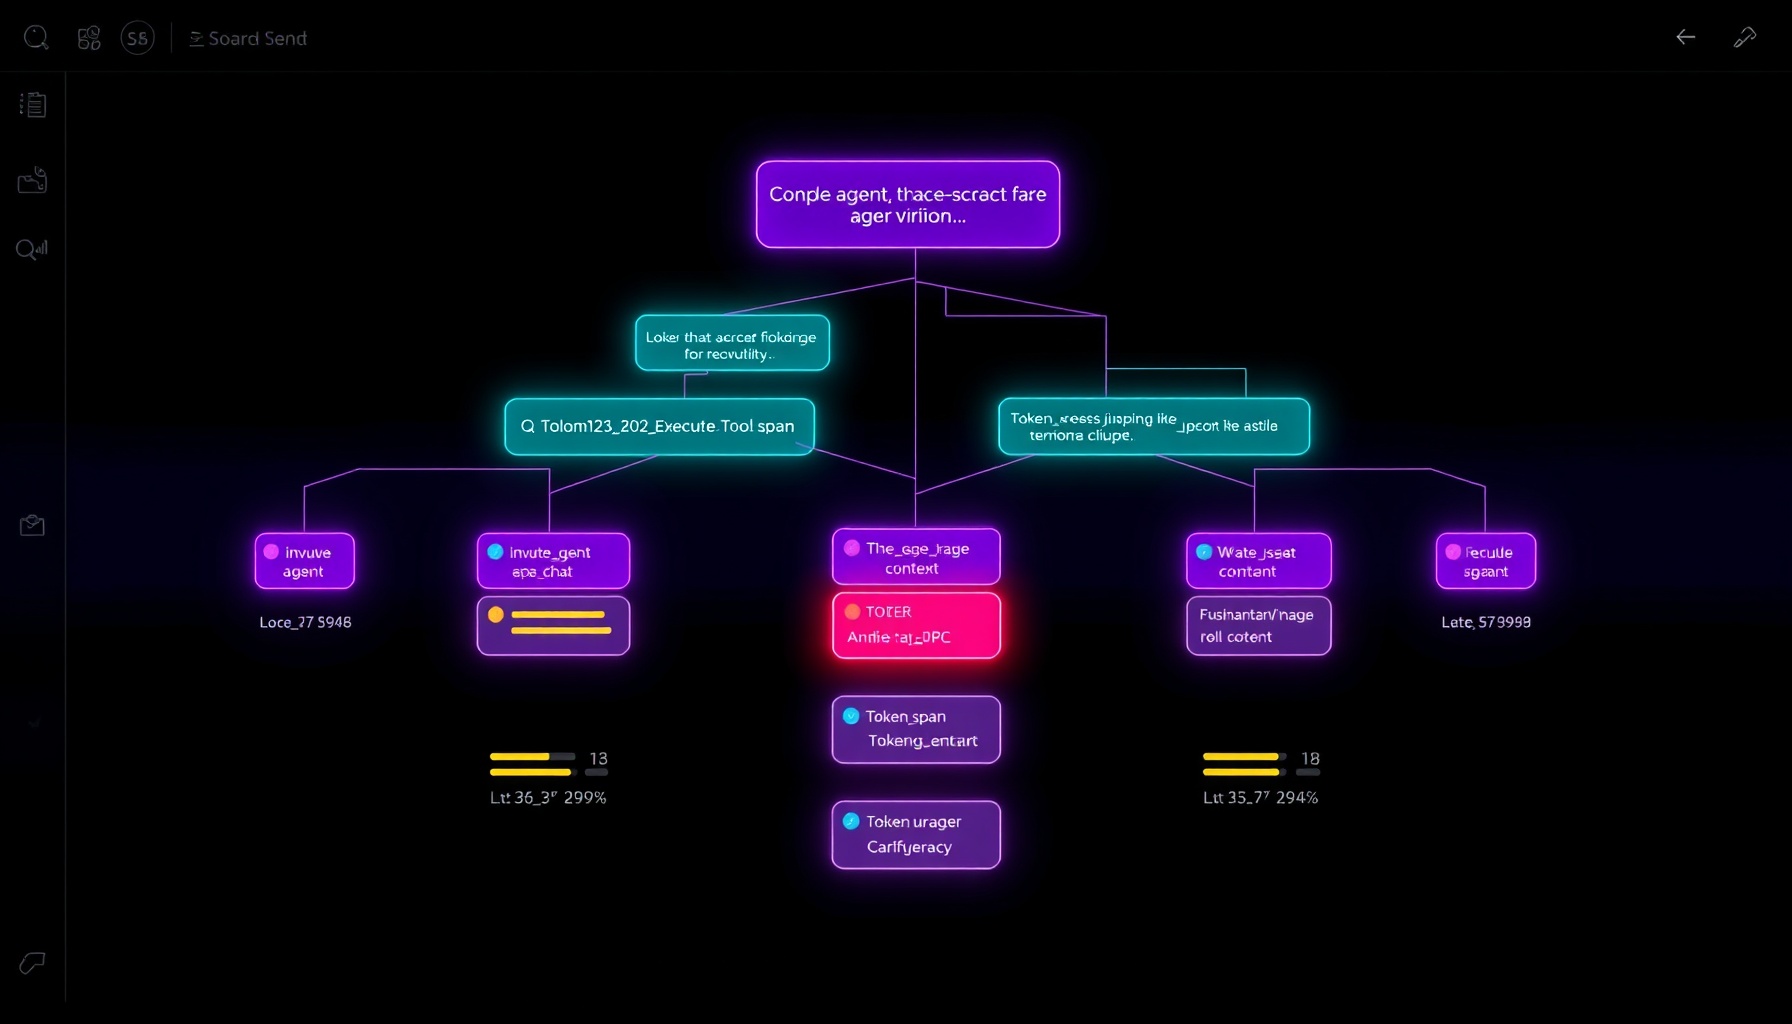
The difference becomes stark when you compare real traces side by side. An OpenInference trace shows the full prompt, the retrieved documents, the tool call chain, and the final response — every semantic edge visible in a single view. The OTEL GenAI trace shows model names and basic latency, but you need to dig into raw span attributes to understand what actually happened Arthur AI, 2026.
How to Set Up OpenInference Instrumentation
Adding OpenInference tracing to a production agent typically requires 5-10 lines of code. Here are the copy-paste setups for three major frameworks:
Google ADK
from opentelemetry import trace as trace_sdk
from opentelemetry.sdk.trace.export import SimpleSpanProcessor, ConsoleSpanExporter
from openinference.instrumentation.google_adk import GoogleADKInstrumentor

tracer_provider = trace_sdk.TracerProvider()
tracer_provider.add_span_processor(
    SimpleSpanProcessor(ConsoleSpanExporter())
)
GoogleADKInstrumentor().instrument(tracer_provider=tracer_provider)
The ADK integrator captures every agent action, LLM call, prompt, and response automatically. The output includes full prompt text, completion text, token counts, cost estimates, and the complete tool call chain.
Mastra
import { OpenTelemetry } from "@mastra/otel";
import { SimpleSpanProcessor, ConsoleSpanExporter } from "@opentelemetry/sdk-trace-base";

const provider = new OpenTelemetry({
  spanProcessors: [new SimpleSpanProcessor(new ConsoleSpanExporter())],
  serviceName: "my-agent",
});
provider.start();
Mastra provides bidirectional OpenTelemetry support — it can both export traces to any OTEL-compatible backend and act as an OpenTelemetry bridge for existing enterprise tracing infrastructure. It traces agents, LLM calls, tools, workflows, integrations, and database operations using standardized GenAI semantic conventions Mastra docs, 2026.
CrewAI
from opentelemetry import trace as trace_sdk
from openinference.instrumentation.crewai import CrewAIInstrumentor

tracer_provider = trace_sdk.TracerProvider()
CrewAIInstrumentor().instrument(tracer_provider=tracer_provider)
CrewAI also provides its own AMP tracing platform, but the OpenInference instrumentation gives you the flexibility to export to any backend without vendor lock-in.
What to Trace: The Five Non-Negotiable Signals
Auto-instrumentation covers the basics, but production agents need custom spans at five specific points:
LLM calls. Every interaction needs full context: prompt, completion, model config, token counts, and cost. Without this, debugging unexpected outputs is guesswork. Arthur’s FDE team found that teams who logged only model names and latency spent 3x longer debugging failures than teams who logged full prompt/response pairs Arthur AI, 2026.
Tool invocations. Capture inputs, outputs, and latency for every tool call. Many performance issues come down to inefficient tool usage — an agent calling the same lookup tool 12 times instead of batching, or a tool that returns 200KB of data when the agent only needs 3 fields. These patterns only become visible in traces.
RAG calls. Agents take wrong actions because they had bad context. Tracing retrieval calls shows exactly which documents were pulled, their relevance scores, and — critically — which documents the agent chose to ignore. The difference between a good agent and a bad one often lives in the retrieval step.
Application metadata. User IDs, session IDs, and domain identifiers connect agent behavior back to real user experiences. When a customer reports an issue, pulling up the exact traces for their session cuts resolution time from hours to minutes.
Key decision points. Manual spans at routing decisions, guardrail checks, and handoff points let you build test datasets and continuous evals from production traces. Arthur’s FDE team routinely instruments these points, then uses the logged context to detect regressions Arthur AI, 2026.
How to Add Manual Spans
from opentelemetry import trace

tracer = trace.get_tracer("agent.custom")

def route_task(task_input: str):
    with tracer.start_as_current_span("agent.routing") as span:
        span.set_attribute("task.category", classify_task(task_input))
        span.set_attribute("task.confidence", confidence_score)
        span.set_attribute("routed_to_model", selected_model)
        return delegated_result
Every decision point should capture:
- What was decided
- Why (the signal that drove the decision)
- What alternative was rejected
- Latency and cost of the decision
The combination of auto-instrumented framework traces + manual custom spans creates a complete picture of agent behavior — not just what the agent did, but the reasoning that led to each action.
Key Takeaways
-
Start with OpenInference, not raw OTEL GenAI conventions — the richer span types (TOOL, CHAIN, RETRIEVER) and explicit message/document types make debugging significantly faster OpenInference spec. The OTEL GenAI conventions are catching up but still lack tool span types.
-
Auto-instrumentation is free but incomplete — every framework covers LLM calls and basic tool tracking, but you must add manual spans for application metadata and decision points.
-
The five signals are not optional — LLM calls, tool invocations, RAG calls, app metadata, and decision points. Missing any one creates blind spots that silently degrade agent performance.
-
Vendor-neutral instrumentation is the only hedge — framework-coupled monitoring (LangSmith for LangChain, AMP for CrewAI) means switching frameworks loses all your traces. OpenTelemetry + OpenInference lets you change frameworks without losing historical data.
-
Invest in observability before production — every team that shipped an agent without tracing regretted it within two weeks. The cost of retrofitting instrumentation is 10x the cost of adding it on day one Arthur AI, 2026.
Sources: Arthur AI — Best Practices for Building Agents Part 1: Observability and Tracing, OpenTelemetry GenAI Semantic Conventions, OpenInference Semantic Conventions, Mastra OTEL Support Docs, Google ADK Docs
arize-ai.github.io/openinference/spec/semantic_conventions.html) Arthur AI, 2026 Arthur AI, 2026
← Back to all posts