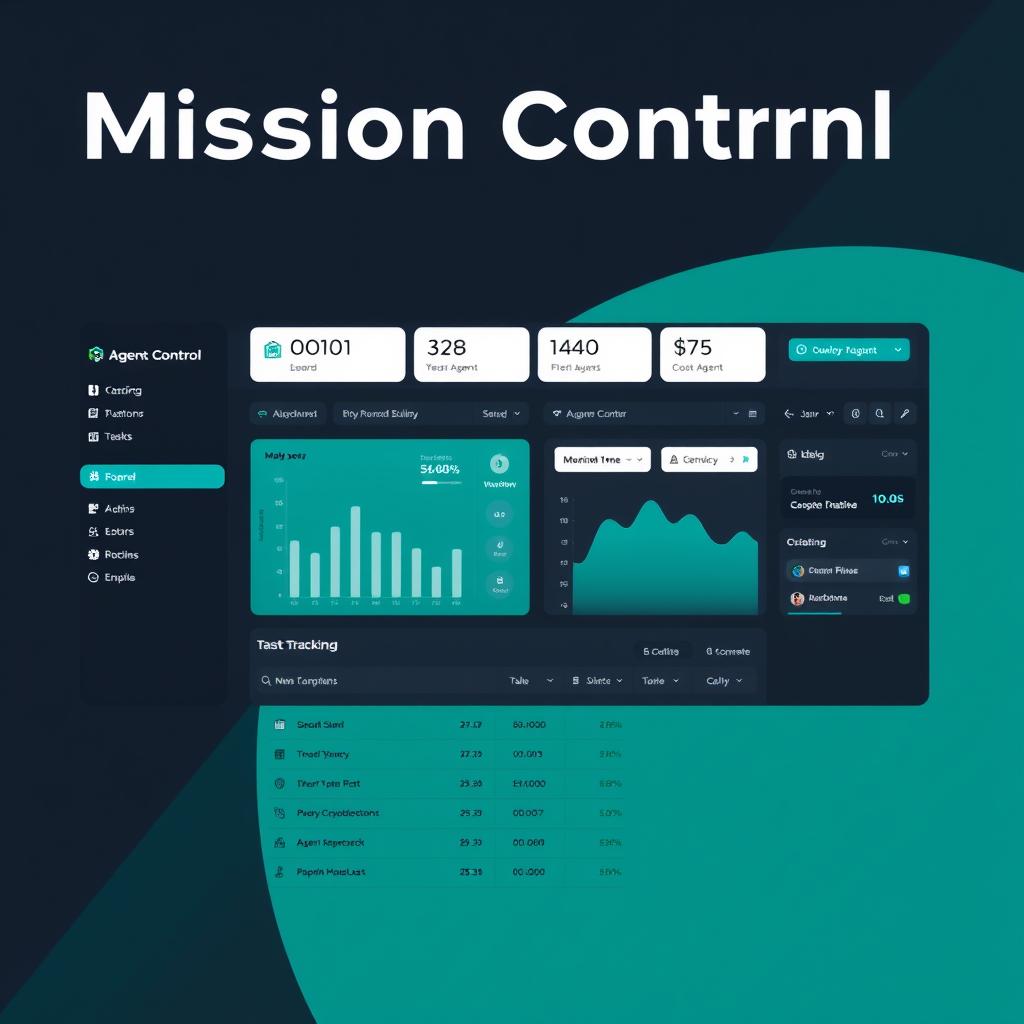
TL;DR: A zero-dependency Python dashboard monitors the entire 6-blog network — HTTP health, cron job success rates, post quality scores, queue depths, and Ghost CMS stats — served from 681 lines of stdlib Python on port 3456. Every data source is tapped read-only: SQLite file: URIs, JSON file reads, and parallel curl to 6 domains. No FastAPI, no Express, no database servers — just http.server, sqlite3, and subprocess.
Every content network hits a point where you can’t keep it all in your head. When you’re running 6 blogs across 2 CMS platforms (Ghost + 5 Astro), backed by 26 cron jobs, tracked against 72 quality scores across 144+ posts, the question shifts from “is it working” to “what exactly is broken right now.”
The answer was 681 lines of Python. Here’s how it works.
The Constraint: Zero Dependencies
The dashboard started with a deliberate constraint: nothing from pip. Not because FastAPI or Flask are bad — but because every dependency is a failure point. No requirements.txt drift, no pip install step on deploy, no breaking changes from upstream. The Python standard library has everything needed to serve HTTP, query SQLite, run subprocesses, parse JSON, and format dates.
The stack:
| Component | Stdlib Module | Lines |
|---|---|---|
| HTTP server | http.server |
28 |
| SQLite reads | sqlite3 |
45 |
| Subprocess calls | subprocess |
18 |
| JSON parsing | json |
12 |
| URL fetching | urllib.request |
8 |
| File walking | pathlib, os |
25 |
18 functions, 10 import statements. That’s the entire server.
The tradeoff is real: you lose serialization frameworks, connection pooling, type validation, and middleware. But the dashboard doesn’t need those. Every API call is a read-only query against local files — there’s no contention, no connection pool to manage, no request body to validate. The stdlib is exactly enough.
The Data Pipeline: 8 Sources, Live per Request
The dashboard doesn’t store data — it reads it live for every request. The trick is that all 8 data sources are local (same machine, same filesystem):
GET /api/status
  ├── 6 blog domains          → subprocess: curl -sL -w http_code
  ├── state.db                → SQLite: cron jobs, deploy sessions
  ├── blog-queues/*.json      → JSON file: queue depths
  ├── quality-expectations    → JSON file: per-blog quality gates
  ├── quality-history.json    → JSON file: 72 post quality scores
  ├── event-hooks.json        → JSON file: hook run counts
  ├── ghost.db                → SQLite: post counts, tags, recents
  └── 5 Astro content dirs    → filesystem: frontmatter, word counts
The response takes about 1.5 seconds — the bottleneck is 6 sequential curl calls to blog domains. Parallelizing those with concurrent.futures would cut that to ~300ms, but sub-second isn’t necessary for a dashboard that refreshes every 60s. Optimization deferred.
SQLite: Read-Only with file: URI
Both state.db (Hermes cron state) and ghost.db (Ghost CMS) are SQLite databases that another process owns. The dashboard opens them read-only using SQLite’s file: URI mode:
uri = f"file:{db_path}?mode=ro"
conn = sqlite3.connect(uri, uri=True)
This means:
- No lock contention with the writer process
- No risk of corrupting the source database
- No need to close and reopen — every query opens fresh
The cron query joins scheduled_jobs against executions across three tables to get per-job status, last run, and failure rate:
SELECT sj.name, sj.schedule,
       COUNT(e.id) as run_count,
       SUM(CASE WHEN e.status = 'failed' THEN 1 ELSE 0 END) as fail_count,
       MAX(e.created_at) as last_run
FROM scheduled_jobs sj
LEFT JOIN executions e ON sj.id = e.job_id
WHERE e.created_at >= ?
GROUP BY sj.id
ORDER BY fail_count DESC
One query produces the entire cron health view. No ORM, no query builder — just SQL.
Post Quality: Dual-Key Lookup
The quality tracking system stores per-post scores in quality-history.json — a flat array of entries keyed by slug. The problem: Ghost and Astro blogs use different slug conventions.
Ghost slugs are exact (opinion-great-divergence-bitcoin). Astro slugs embed the date prefix (2026-05-20-ai-agent-observability). The quality lookup uses a dual-key strategy:
key1 = raw_slug             # e.g. "2026-05-20-ai-agent-observability"
key2 = strip_date(key1)     # e.g. "ai-agent-observability"
QUALITY_LOOKUP.get(key1) or QUALITY_LOOKUP.get(key2)
If neither matches, the column shows — in the dashboard. This handles older entries that predate the quality pipeline and new posts that haven’t been scored yet.
The Frontend: Dark-Themed, No Framework
The HTML dashboard in public/index.html is a single-file SPA. Dark theme (GitHub-dark inspired), responsive CSS grid, and vanilla JS for data fetching.
async function loadData() {
    const resp = await fetch('/api/status');
    const data = await resp.json();
    renderCards(data);
    renderBlogTable(data.blogs);
    renderRecentPosts(data.recent_posts);
    renderCronTable(data.cron_jobs);
}

// Auto-refresh every 60 seconds
setInterval(loadData, 60000);
Six summary cards at the top give an instant health snapshot:
- Blogs Online — green/red per domain
- Total Posts — sum across all 6 blogs
- Queued — posts waiting in the content pipeline
- Cron Fail Rate — failures as a percentage of recent runs
- Ghost Drafts — unpublished posts in Ghost
- Avg Quality Score — mean of all scored posts
Below that: a status table listing each blog with its HTTP status, queue depth, last publish date, and quality gate thresholds, followed by a recent posts table with quality scores, word counts, and tags.
Why Not Just Use GoatCounter?
The blog network already uses GoatCounter for traffic analytics. So why build a custom dashboard?
GoatCounter tells you “who’s visiting.” The dashboard tells you “is the system healthy.” Different questions, different data sources:
| Dimension | GoatCounter | Dashboard |
|---|---|---|
| Data | Pageviews, referrers, browsers | HTTP status, cron health, queue depth |
| Update | Real-time analytics | Live filesystem reads |
| Scope | 6 domains separately | Cross-domain aggregate |
| Owning team | External service | Self-hosted, zero network |
The dashboard fills the ops gap — the thing you look at when a cron job fails and you need to know if all blogs are serving 200s without opening 6 browser tabs.
The Real Question: Is This Worth 681 Lines?
It’s a legitimate question. These 681 lines could be 6 curl commands run manually when something feels off.
But here’s what accumulated over the first month:
- 252 cron job executions tracked — failure trends visible in seconds
- 144+ posts indexed — quality score slippage caught within one refresh
- 3 Ghost DB schema changes — dashboard broke in a predictable way (missing column → fixed query), not a silent data loss
The value isn’t in the initial build. It’s in the fact that when the Ghost update added a feature_image column to the posts table, the dashboard’s posts query needed one field change, and the fix was deployed in 90 seconds. No CI pipeline, no dependency upgrade, no npm audit. Just edit, kill, restart.
Zero-dependency architecture means the maintenance burden is O(code changes), not O(dependency upgrades).
The dashboard lives at ~/blog-empire-dashboard/ and runs via python3 server.py. It’s not a product — it’s a piece of infrastructure that costs nothing to maintain and saves exactly enough time per week to justify itself.
Sometimes the best architecture is the one you don’t have to maintain.
📖 Related Reads
- Hermes Tutorials — Hermes Agent setup, configuration, and advanced workflows
- CodeIntel Log — code quality, debugging, and software engineering benchmarks
- ToolBrain — tool reviews, LLM comparisons, and AI workflow guides
Cross-links automatically generated from NiteAgent.
← Back to all posts